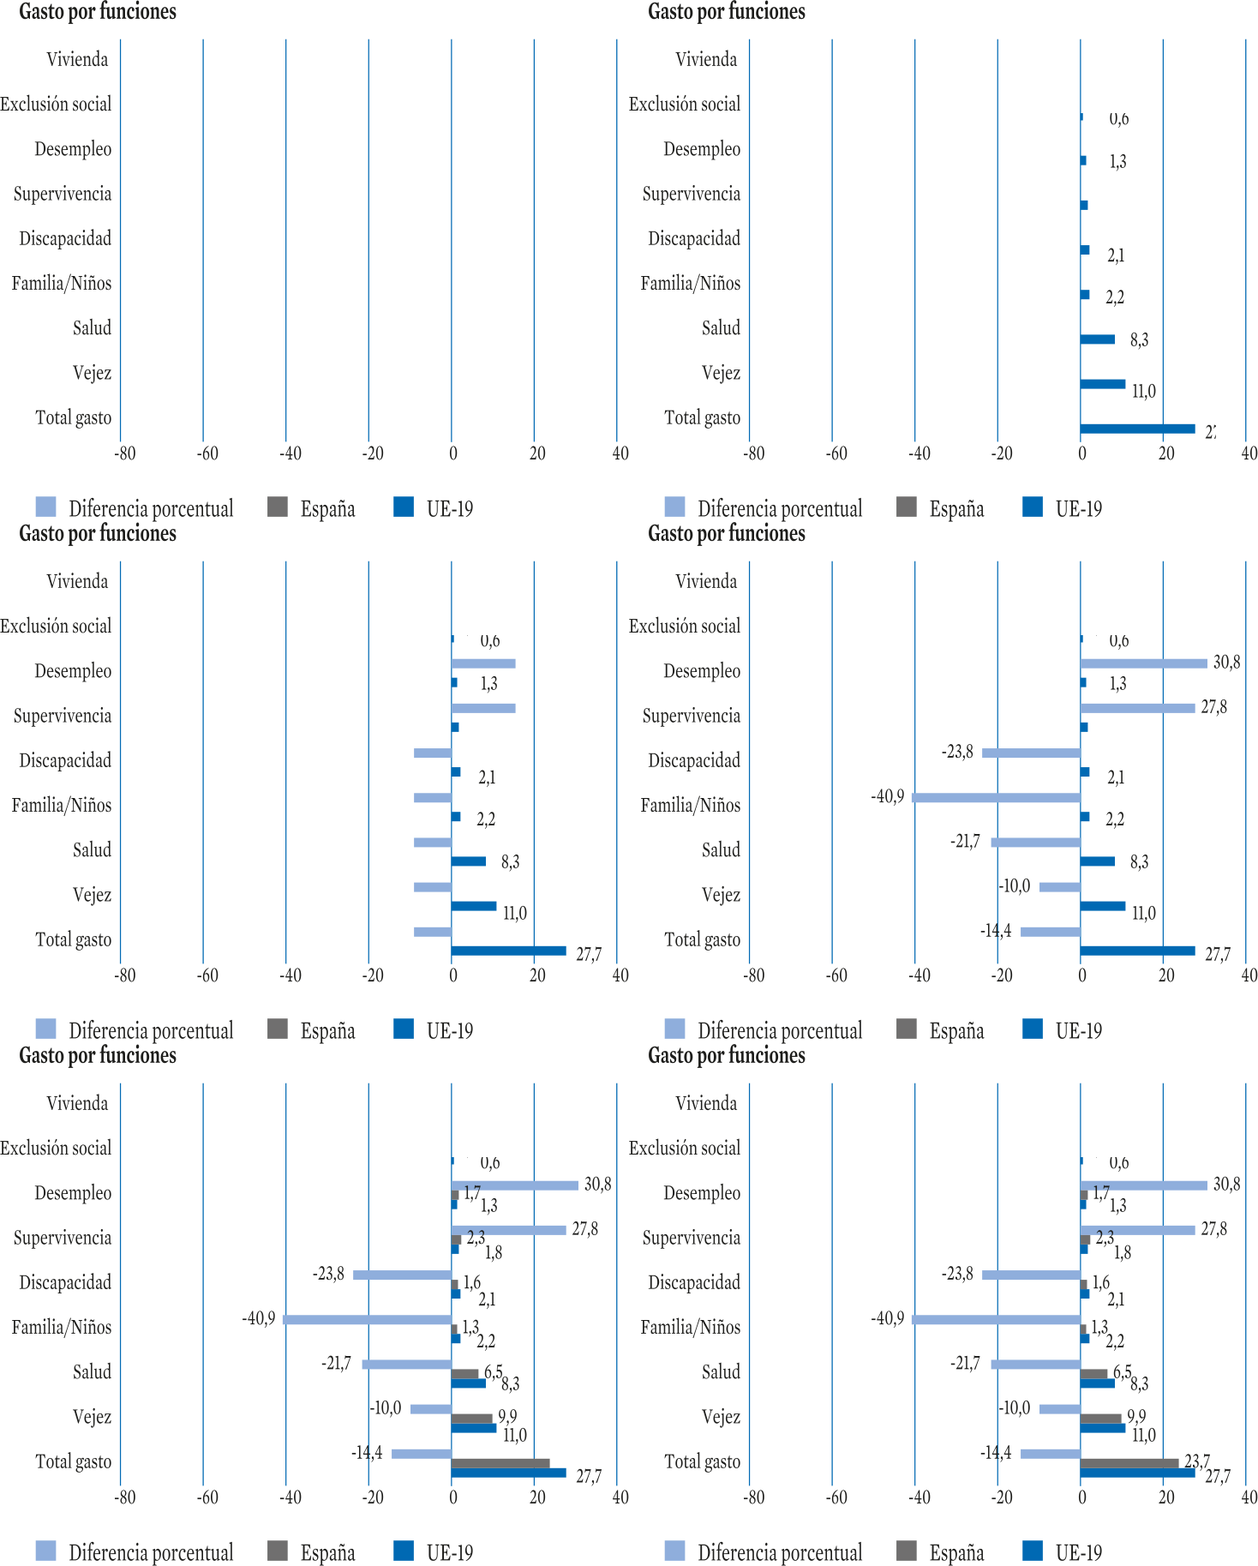
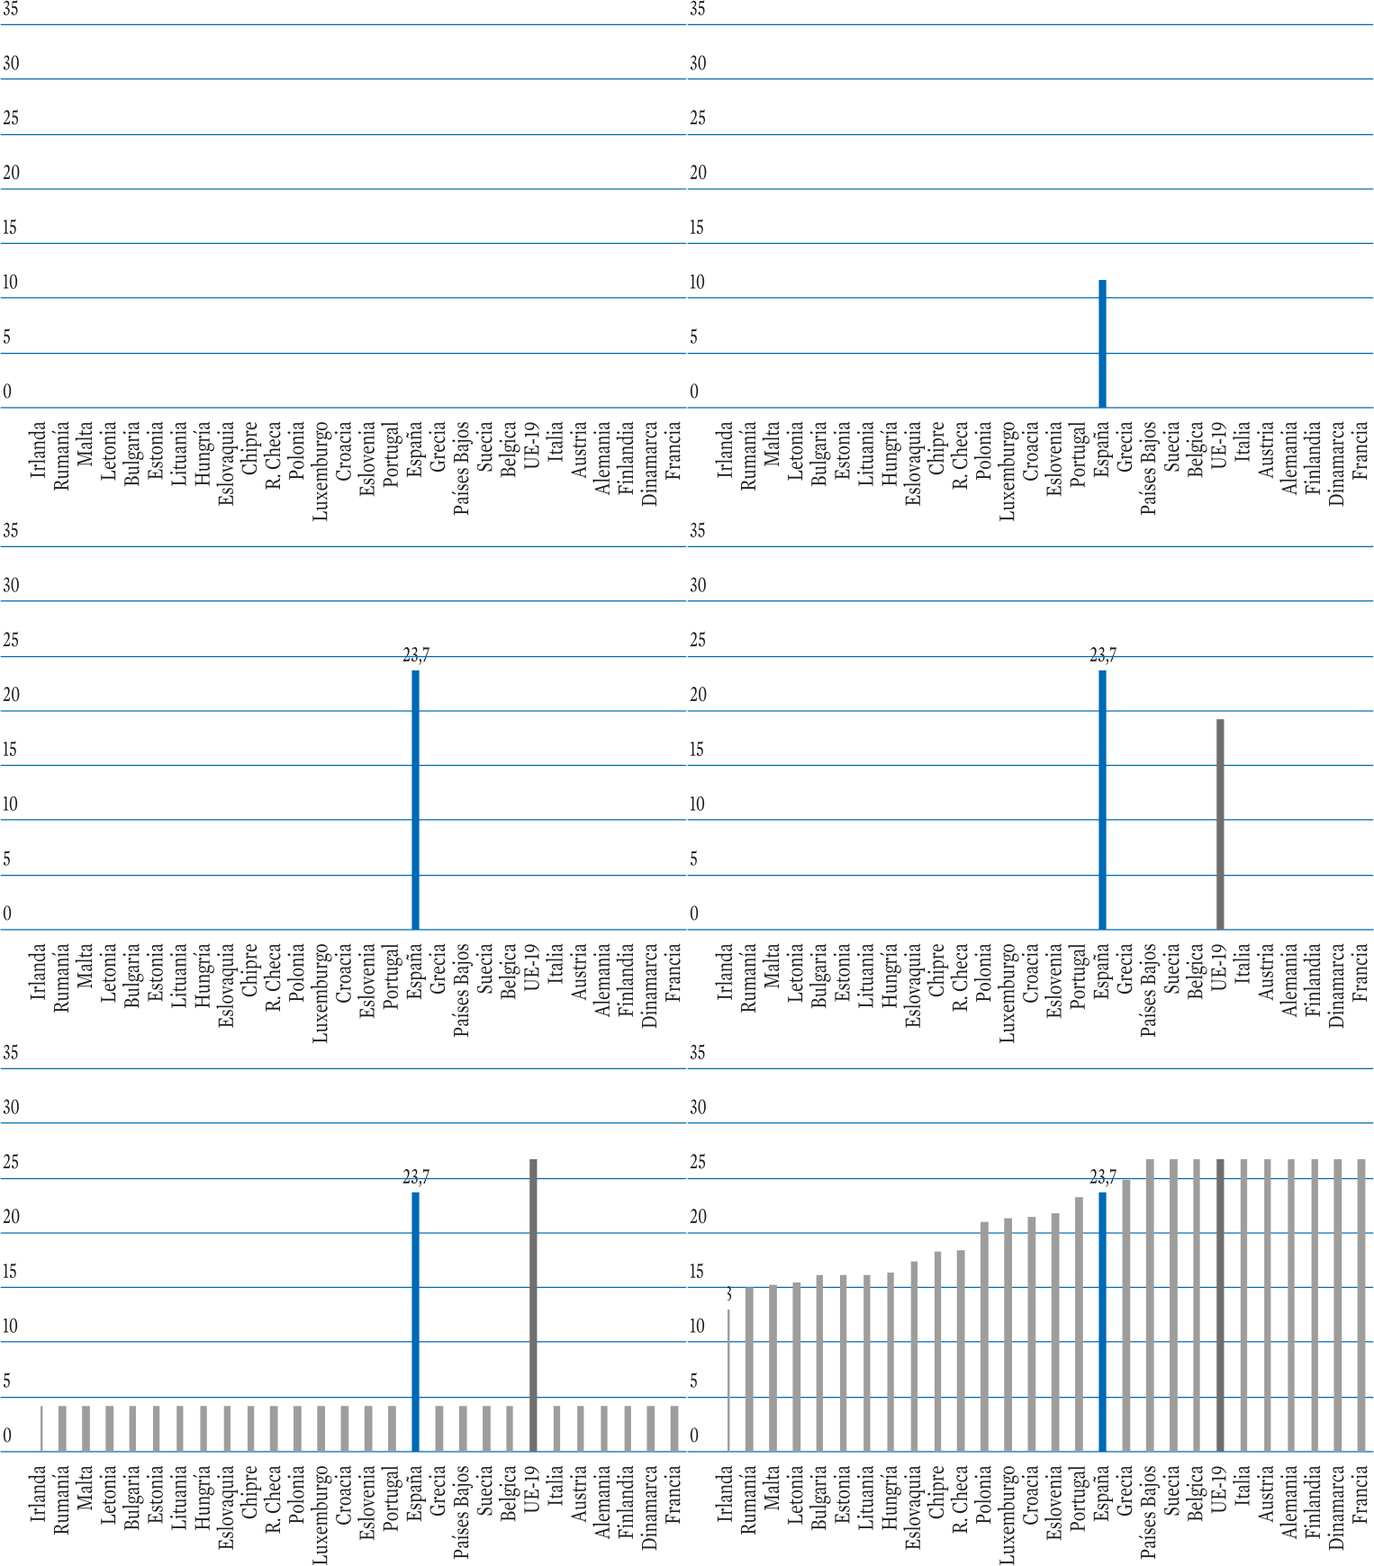
Gráfico R-9. Gasto en protección social y por funciones.
España y UE-19, 2019
(En porcentaje sobre el PIB)
Fuente: Eurostat, ESSPROS.